3

There is a significant chance that this has been covered on SE, but I haven't yet found anything similar enough for my taste (see related questions, below).


Question:

How could I go about coming up with a good estimate of the average energy consumption (per unit volume) of residential US city water in

  1. A fairly water-abundant area
  2. A fairly water-scarce area,

assuming that I am in a low-rise building using cold water that I do not soften or filter, and that the water is going straight from my sink into the drain? I want to include the "downstream" costs of treatment, etc.


Background:

  • For specificity, you can imagine that I'm talking about Washington, D.C. or Los Angeles.
  • I'm interested in a range of interpretations of "energy," so feel free to include/exclude things like indirect effects on other water consumers, opportunity costs, embodied energy of water treatment chemicals, etc.
  • I am not so concerned about distinguishing between marginal and average cost; either one would satisfy me.
  • Related questions: here, here, here
  • My best guess so far: seems like a reasonable estimate excluding chemical production would be 3.6Wh/gallon, based on the municipal treatment and pumping cost from p4 of this study.
  • I have this unsourced number from a forum where the people seem really smart, here (reply #7), which is around 15Wh/gallon and seems to apply to both city and rural water in the UK.
  • This study from an open access journal for the entire US, says that "residential" "withdrawals" were around 29 billion gallons per day in 2005 and "residential" "direct" energy use for steam plus for heating, chilling, treating, pressurizing and pumping water was 4.47 quads in 2010, if I understand correctly. So if I assume steam=0, withdrawals=consumption, and 2005=2010, I get 4.47*[293 trillion]/(365*29 billion) Wh/gallon which is around 120Wh/gallon. I'm guessing maybe half to 75% of that is heating so I would get like 30Wh/gallon? Then maybe I should subtract a little bit because the steam use will be more energy-intensive on average?
2
  • 1
    Is there a practical point to this question? By that I mean, regardless of what the answer may or may not be (0.5x, x, 2x), what difference would it make? How could any answer to this question be used in a tangible and constructive way?
    – Tim
    Commented Sep 26, 2020 at 9:35
  • 1
    @Tim Good question! The answer could affect how much water I choose to use; in fact, I currently face a situation in my own life where I have to choose between using more water or more electricity. Also, the way that the answer is arrived at could affect my understanding of our water system, and that understanding could affect how I act as a "citizen," e.g. voting/advocacy/consumer choices/charitable giving.
    – capet
    Commented Oct 10, 2020 at 4:27

1 Answer 1

2

Check the TRM for recent, state-specific data

Illinois (and probably other states) now requires energy efficiency programs to estimate the energy impact of water supply and discharge -- in Illinois, the value is 0.68 watt-hours per liter (footnote 122 of the Illinois Technical Reference manual). The TRM of the state you're interested in would probably contain the most complete data. Any state with a publicly-mandated energy efficiency program will have a TRM or similar guide. However, for general ranges, there are a couple of other resources.

2011 nationwide data

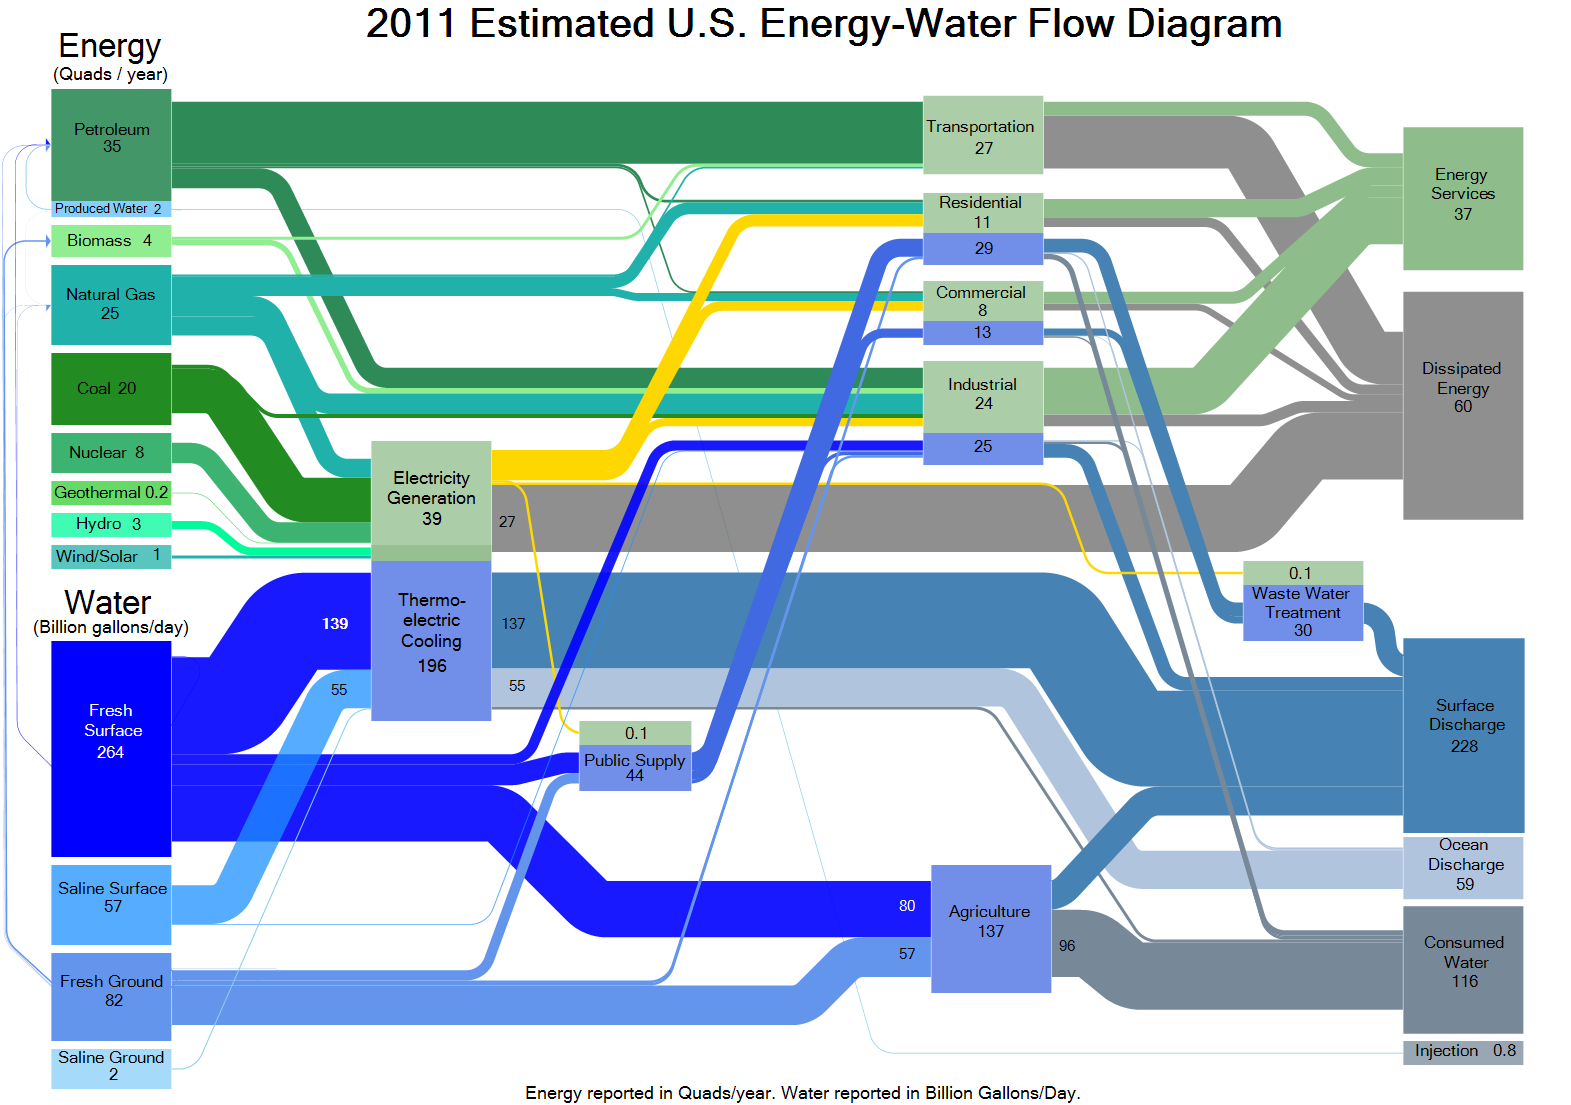
In 2014, the Department of Energy published the report "The Water-Energy Nexus: Challenges and Opportunities" which includes this Sankey diagram using 2011 data:

enter image description here

A quad of energy is one quadrillion Btu. Doing the math, the nationwide averages are:

Category Wh per L
Public supply 0.48
Waste water treatment 0.71
Total 1.19

2010 state-level data

In 2017, the DOE's Lawrence Livermore National Lab compiled state-level Sankey diagrams for all 50 states using 2010 data: "Hybrid State Energy-Water Nexus 2010 Report". You can download detailed data for each state.

You asked about Los Angeles, CA and Washington, DC. DC is not in the chart so I'll use the neighboring states of Maryland and Virginia. Here are the totals, along with Illinois for comparison to the more specific number above.

State Supply (Wh/L) Wastewater (Wh/L) Total
California 0.65 1.03 1.68
Illinois 0.42 0.61 1.03
Maryland 0.43 0.54 0.97
Virginia 0.45 0.39 0.84

Your Answer

By clicking “Post Your Answer”, you agree to our terms of service and acknowledge you have read our privacy policy.

Not the answer you're looking for? Browse other questions tagged or ask your own question.